ReactJS

Introduction

Welcome, adventurous souls and curious minds, to the delightful world of Mapbox. Mapbox is a powerful mapping platform that enables developers to create interactive and visually appealing maps for web and mobile applications. Two fundamental concepts in Mapbox are layers and sources, which form the building blocks of map design and data integration. In this blog post, we will delve into the world of location-based services and discuss how we can incorporate multiple features like drawing on maps, how layers and sources work, how to add markers and popups, searching for a place using its name or coordinates, zooming in/out, switching between different views, and more. Let’s dive in!

Why Mapbox?

Mapbox stands out among other mapping platforms due to its flexibility, customization options, and developer-friendly APIs. Whether you’re building a web or mobile application, Mapbox provides a robust set of tools to create visually appealing maps, integrate geolocation services, and add interactive features.

Prerequisites

Before we begin, make sure you have the following set up:(Source)

1. Mapbox account: Sign up for a Mapbox account at https://www.mapbox.com/.
2. Mapbox GL JS library: Include the Mapbox GL JS library in your React JS App.

Getting Started

To begin using Mapbox in React JS, follow these steps :

Create a Mapbox account

Head over to the Mapbox website https://www.mapbox.com/ and sign up for an account.

Once registered, generate an access token, This token will authenticate your requests and allow you to access Mapbox’s APIs and services. Once you have your access token, you’re ready to start drawing on maps!

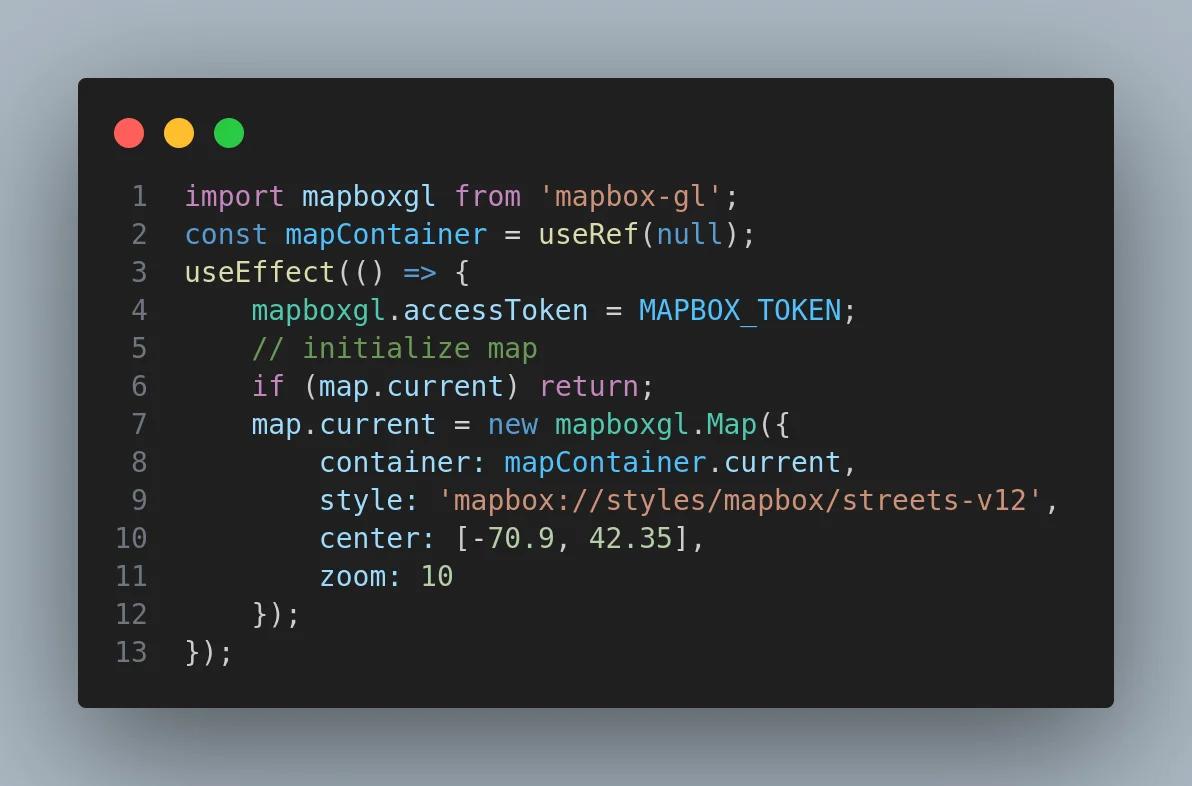
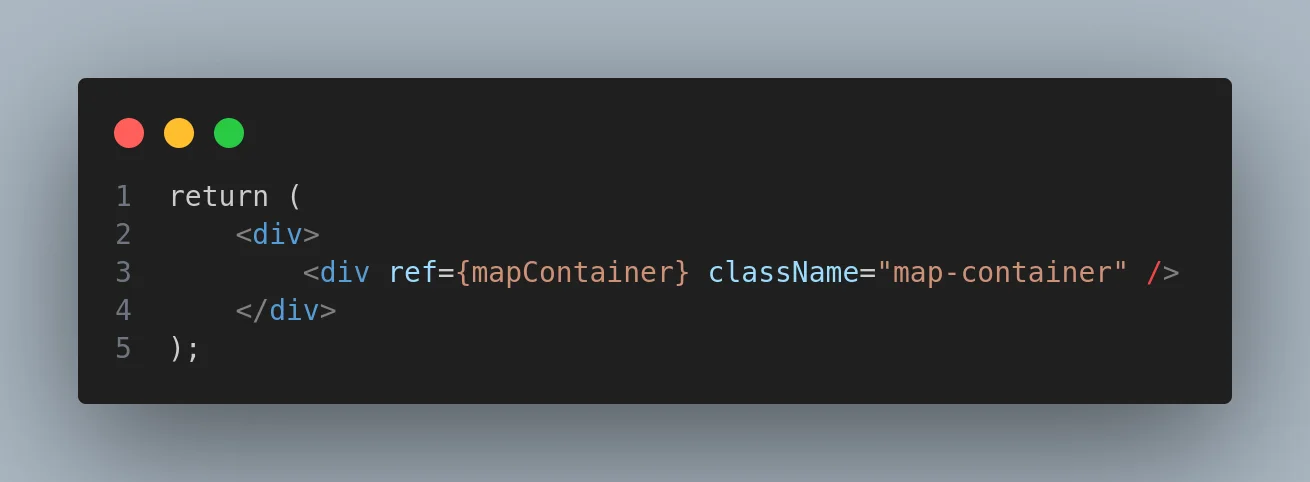
Now, Import Mapbox libraries into our React JS App.js page and configure the access token :

react_mapbox_image5

react_mapbox_image8

Sources: The Data Integration Layer

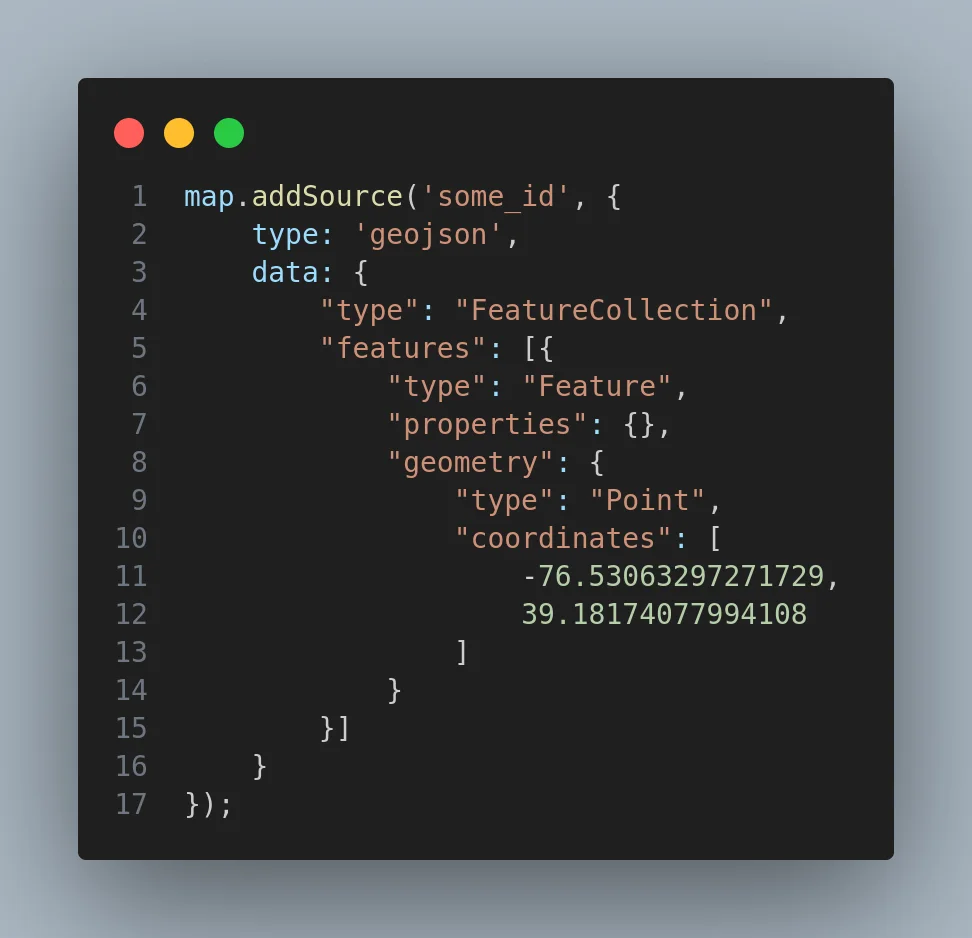
Sources in Mapbox represent the data that powers your map. They provide a way to integrate spatial data from various sources into your map visualization. Sources can be static files (such as GeoJSON or Shapefiles) or dynamic data fetched from APIs or databases.

Mapbox supports different types of sources, including:

1. Vector Sources: Used for displaying vector data, such as points, lines, and polygons. These sources are ideal for handling large datasets efficiently.

2. Raster Sources: Used for rendering raster data, such as satellite imagery or elevation models. Raster sources are typically used for basemaps or background layers.

3. GeoJSON Sources: Used for working with GeoJSON data, a widely used format for representing geographic features.

react_mapbox_image11

Layers: The Visual Building Blocks

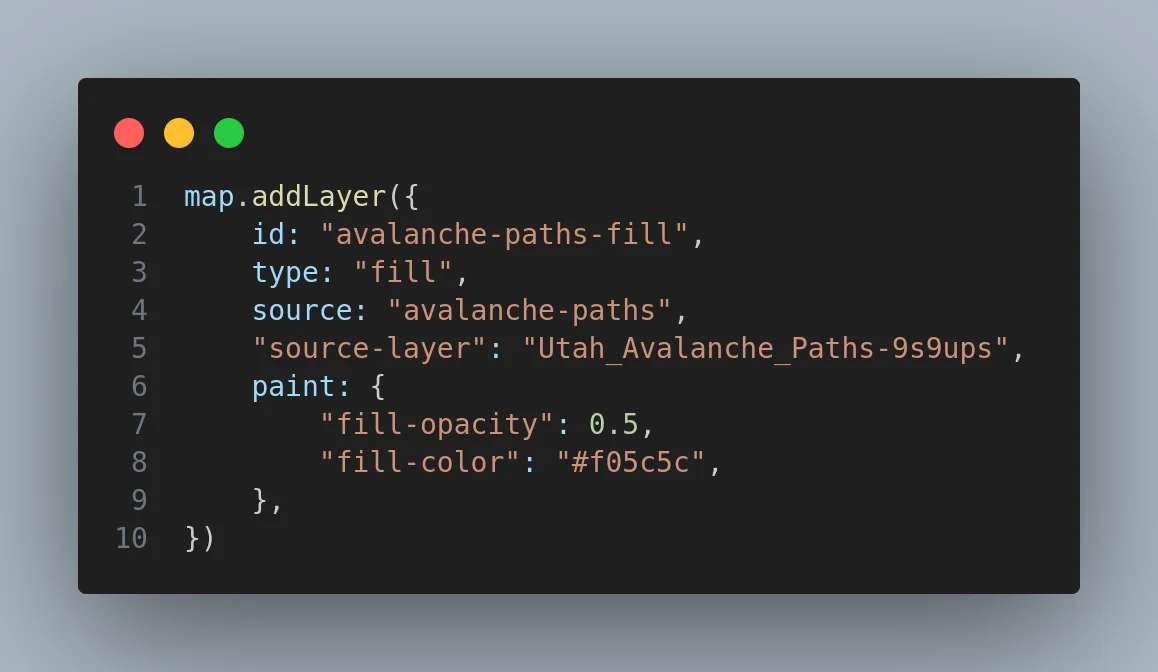
In Mapbox, layers are the visual building blocks that allow you to display and style different types of data on a map. Each layer represents a specific data type or visual element, such as roads, buildings, water bodies, or custom markers.

Mapbox supports various layer types, including:

1. Fill Layer: Used for coloring polygons or areas.

2. Line Layer: Used for drawing lines and paths.

3. Symbol Layer: Used for displaying icons or labels at specific locations.

4. Raster Layer: Used for rendering raster images or tilesets.

5. Circle Layer: Used for displaying circular markers or points.

Also, Mapbox can provide Layer Styling for changing colors, adjusting opacity, modifying stroke widths, and applying filters.

react_mapbox_image1

Adding Draw Functionality

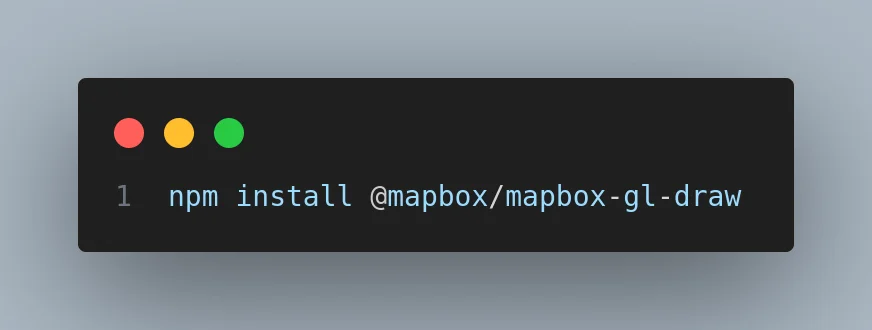
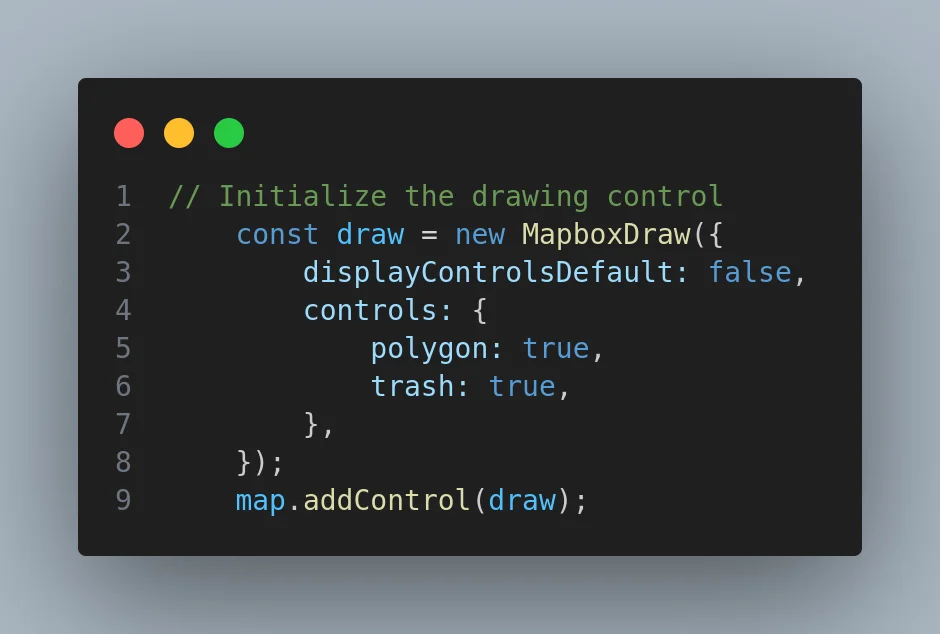
To enable drawing on the map, we can use Mapbox GL Draw, a library that provides tools for drawing on Mapbox maps.

Install the Mapbox GL Draw library:

react_mapbox_image10

Modify the App.js component and add the below snippets after initializing the map to include drawing functionality:

react_mapbox_image3

Searching for a Place

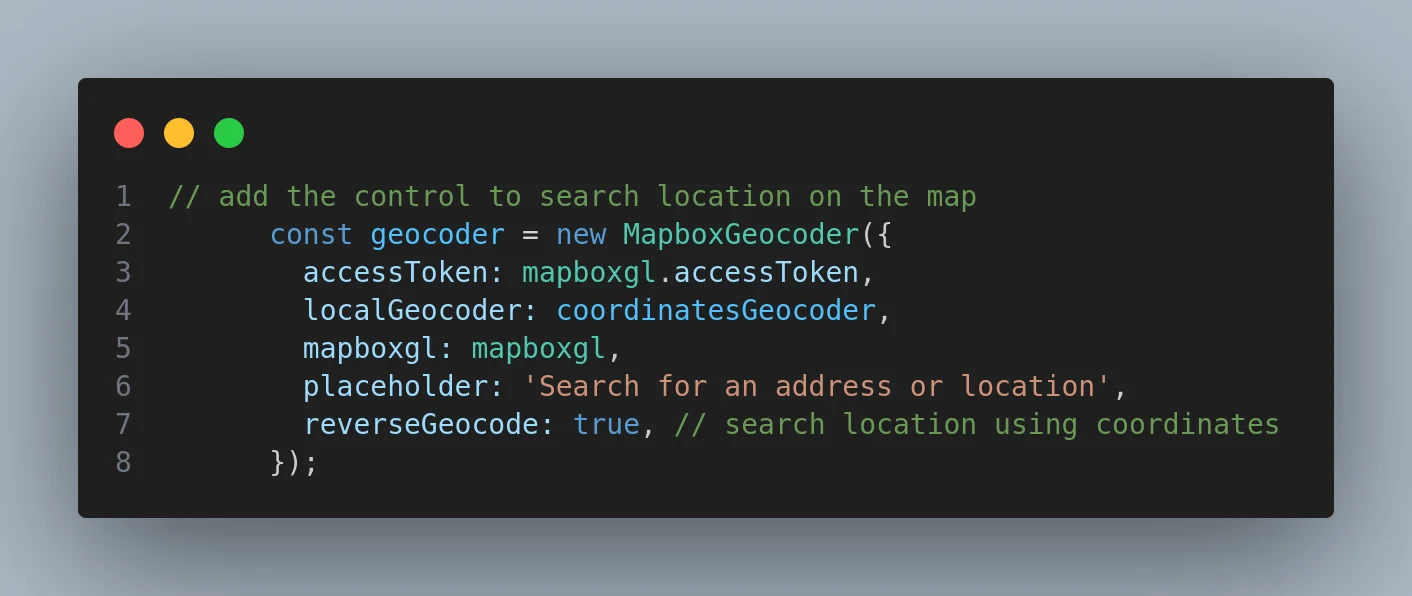
One of the fundamental features of a map application is the ability to search for a specific place. Users should be able to search for a place by either entering its name or its coordinates.

Add the Mapbox Geocoding Control to your map. This control provides an input field for users to search for locations:

react_mapbox_image9

Zooming In/Out

Zoom functionality is crucial for providing users with varying levels of detail. Users should be able to zoom in to see street-level details or zoom out to get a broader view of the area. Mapbox provides maps in 23 zoom levels, with 0 being the lowest zoom level (fully zoomed out) and 22 being the highest (fully zoomed in). (Source) We can add the zoom control to the map using NavigationControl().

Adding Marker

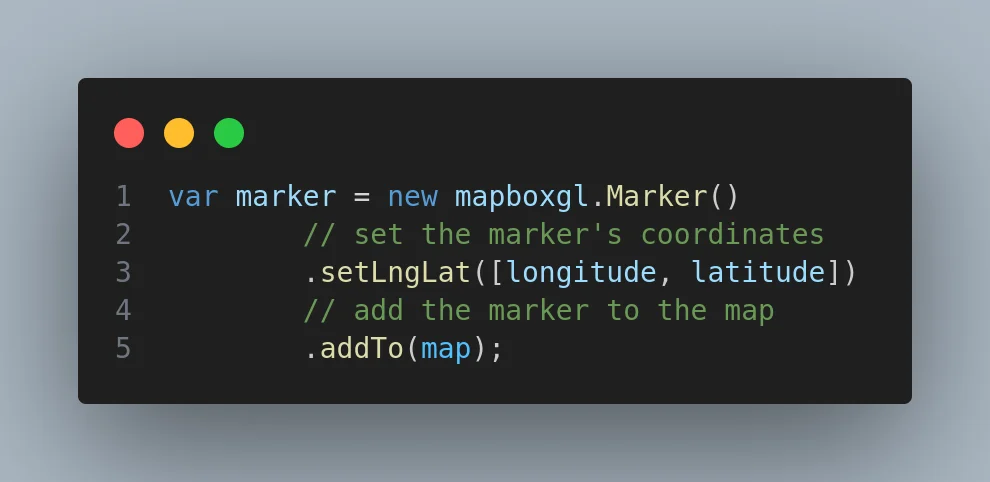
Adding markers in Mapbox GL is a common task when creating interactive maps. You can add markers to the map using the new mapboxgl.Marker() constructor and then add them to the map using the .setLngLat() and .addTo() methods.

react_mapbox_image2

Adding Popup

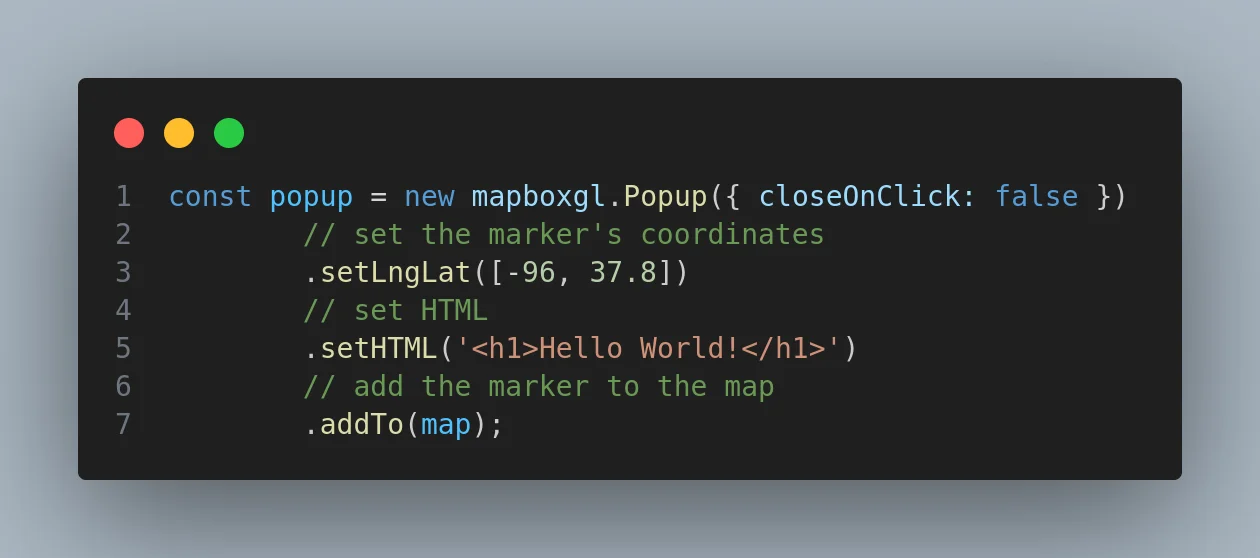
Similarly, like markers you can add a popup to the map using the new mapboxgl.Popup() constructor and then add them to the map using the .setLngLat(), .setHTML(), and .addTo() methods.

react_mapbox_image6

Different Views

Mapbox offers a variety of map styles to be presented in various views, such as Streets, Outdoors, Satellite, Light, Dark, and terrain. Mapbox also provides the ‘style’ property for initializing the map for setting the initial view according to our desired view.

To change between these different views, you typically need to use the setStyle() function and options provided by the Mapbox GL JS library. Here’s a general idea of how you might switch between these views:

react_mapbox_image7

Mapping and Navigation

Mapbox offers comprehensive mapping and navigation services, enabling developers to integrate highly interactive and customizable maps into their applications. These services are designed to help you create interactive maps, integrate location-based features into your applications, and develop custom navigation solutions.

Conclusion

In the realm of mapping and location-based services, Mapbox stands as an invaluable ally for developers. With its seamless integration, versatile features, and user-friendly APIs, Mapbox empowers us to create immersive and dynamic maps. Markers provide visual representations of specific locations, while popups allow you to display additional information when a user interacts with a marker. Layers and sources are essential components of Mapbox that enable you to build dynamic and interactive maps. Drawing on maps using Mapbox opens up a world of possibilities for creating engaging and informative visualizations.

So, are you ready to take your maps to the next level? Partner with Bytes Technolab Inc. and embark on a journey to mapping innovation today!

Related Blogs

ChatGPT to Custom LLMs: When to Hire OpenAI Experts vs. In-House Teams

ChatGPT to Custom LLMs: When to Hire OpenAI Experts vs. In-House Teams

In just a few short years, AI has shifted from being an experimental playground for tech giants to a competitive edge for businesses of all shap...

AI Development + Product Maintenance: Why You Need Both for Long-Term Success

AI Development + Product Maintenance: Why You Need Both for Long-Term Success

The reality is that an AI application development project can never be a one-shot, boom. It’s not like shipping a website or releasing an app ...

From OpenAI Prototypes to Production: Our End-to-End Development Process

From OpenAI Prototypes to Production: Our End-to-End Development Process

AI promises have always been rather appealing. AI has gone much beyond science fiction, from forecasting what your consumers want before they sa...